Reducing complexity in retail product space allocation
Providing data to increase the accuracy of allocation decisions


CLIENT
Nationwide retailer operates on a limited-item business model, providing members with access to a wide range of quality products at exceptional prices. With a focus on delivering value, it offers exclusive savings, premium quality items, and various services.
DESIGN CHALLENGE
Retail product space allocation is complex and data-intensive, often lacking precision. To improve this, incorporating Annual Sales Lift data and constraints-based optimization can enhance decision-making. Providing contextual optimization details streamlines the process, ensuring efficiency and timely implementation.
USERS
• Space Allocation Decision Makers
MY ROLE
•UX Designer
•UX Researcher
•Facilitator
DISCOVERY

My comparative analysis of similar tools yielded opportunities for improving the results presented by our tool. Referencing historical data and allowing for customization of scenarios were just a few of the opportunities uncovered.


By interviewing key stakeholders I gathered insights on pain points, needs and planning concerns.
PERSONA
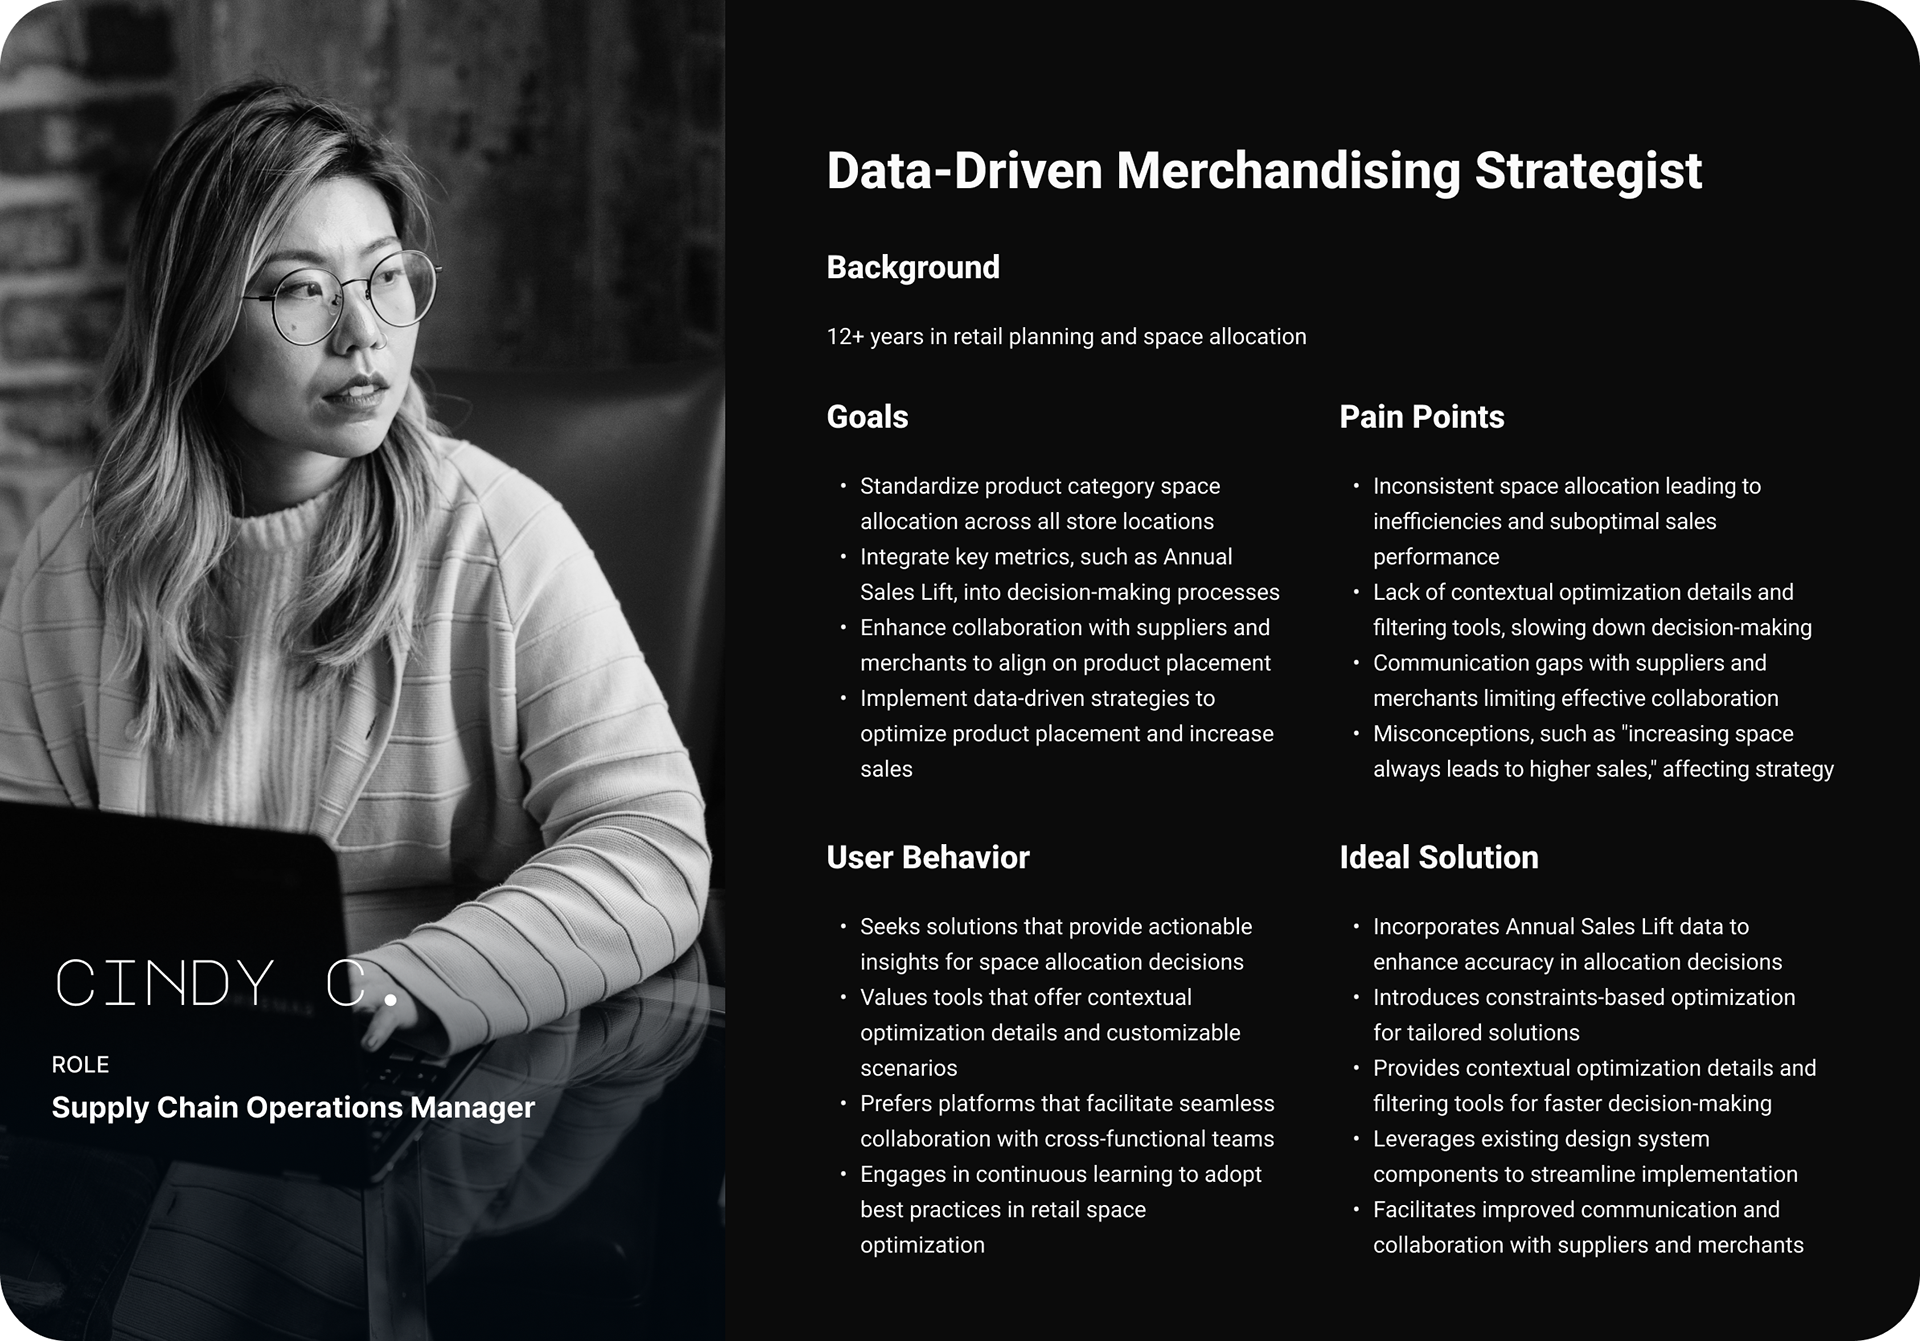
To guide the project, I created a persona representing a retail space planner named Cindy. Cindy is a data-driven professional who struggles with integrating metrics like Annual Sales Lift and applying constraints. I tailored solutions to meet Cindy’s needs, focusing on more accurate decision-making, improved optimization, and faster analysis. This persona helped me design user-centric tools that address real-world pain points and enhance productivity.
DISCOVERY INSIGHTS
Inconsistent product category space allocation created challenges in standardizing decisions across stores.
Lack of category grouping at the store level led to inefficiencies and difficulty in decision-making.
The belief that “increasing space always leads to higher sales” was identified as a misconception impacting strategy.
Communication gaps with suppliers and merchants were limiting collaboration and alignment.
A territorial mindset among stakeholders (e.g., reluctance to adjust category space) was hindering overall sales performance.
Cross-sell opportunities were not prioritized in planning, reducing potential revenue growth.
IDEATION

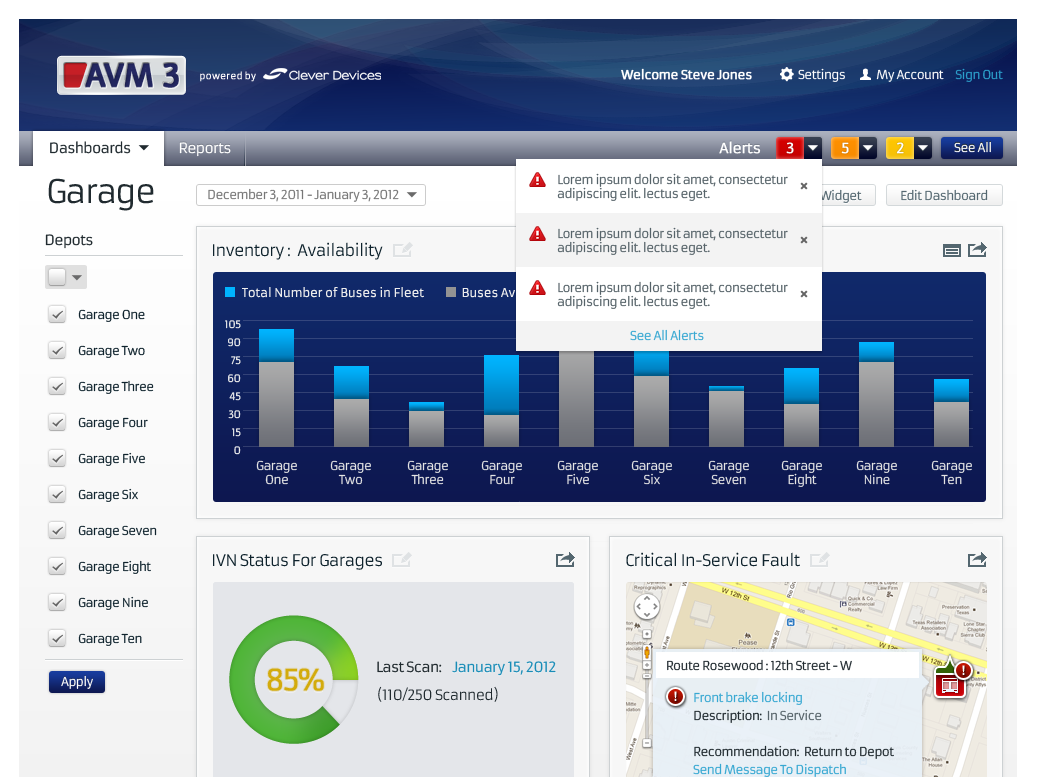
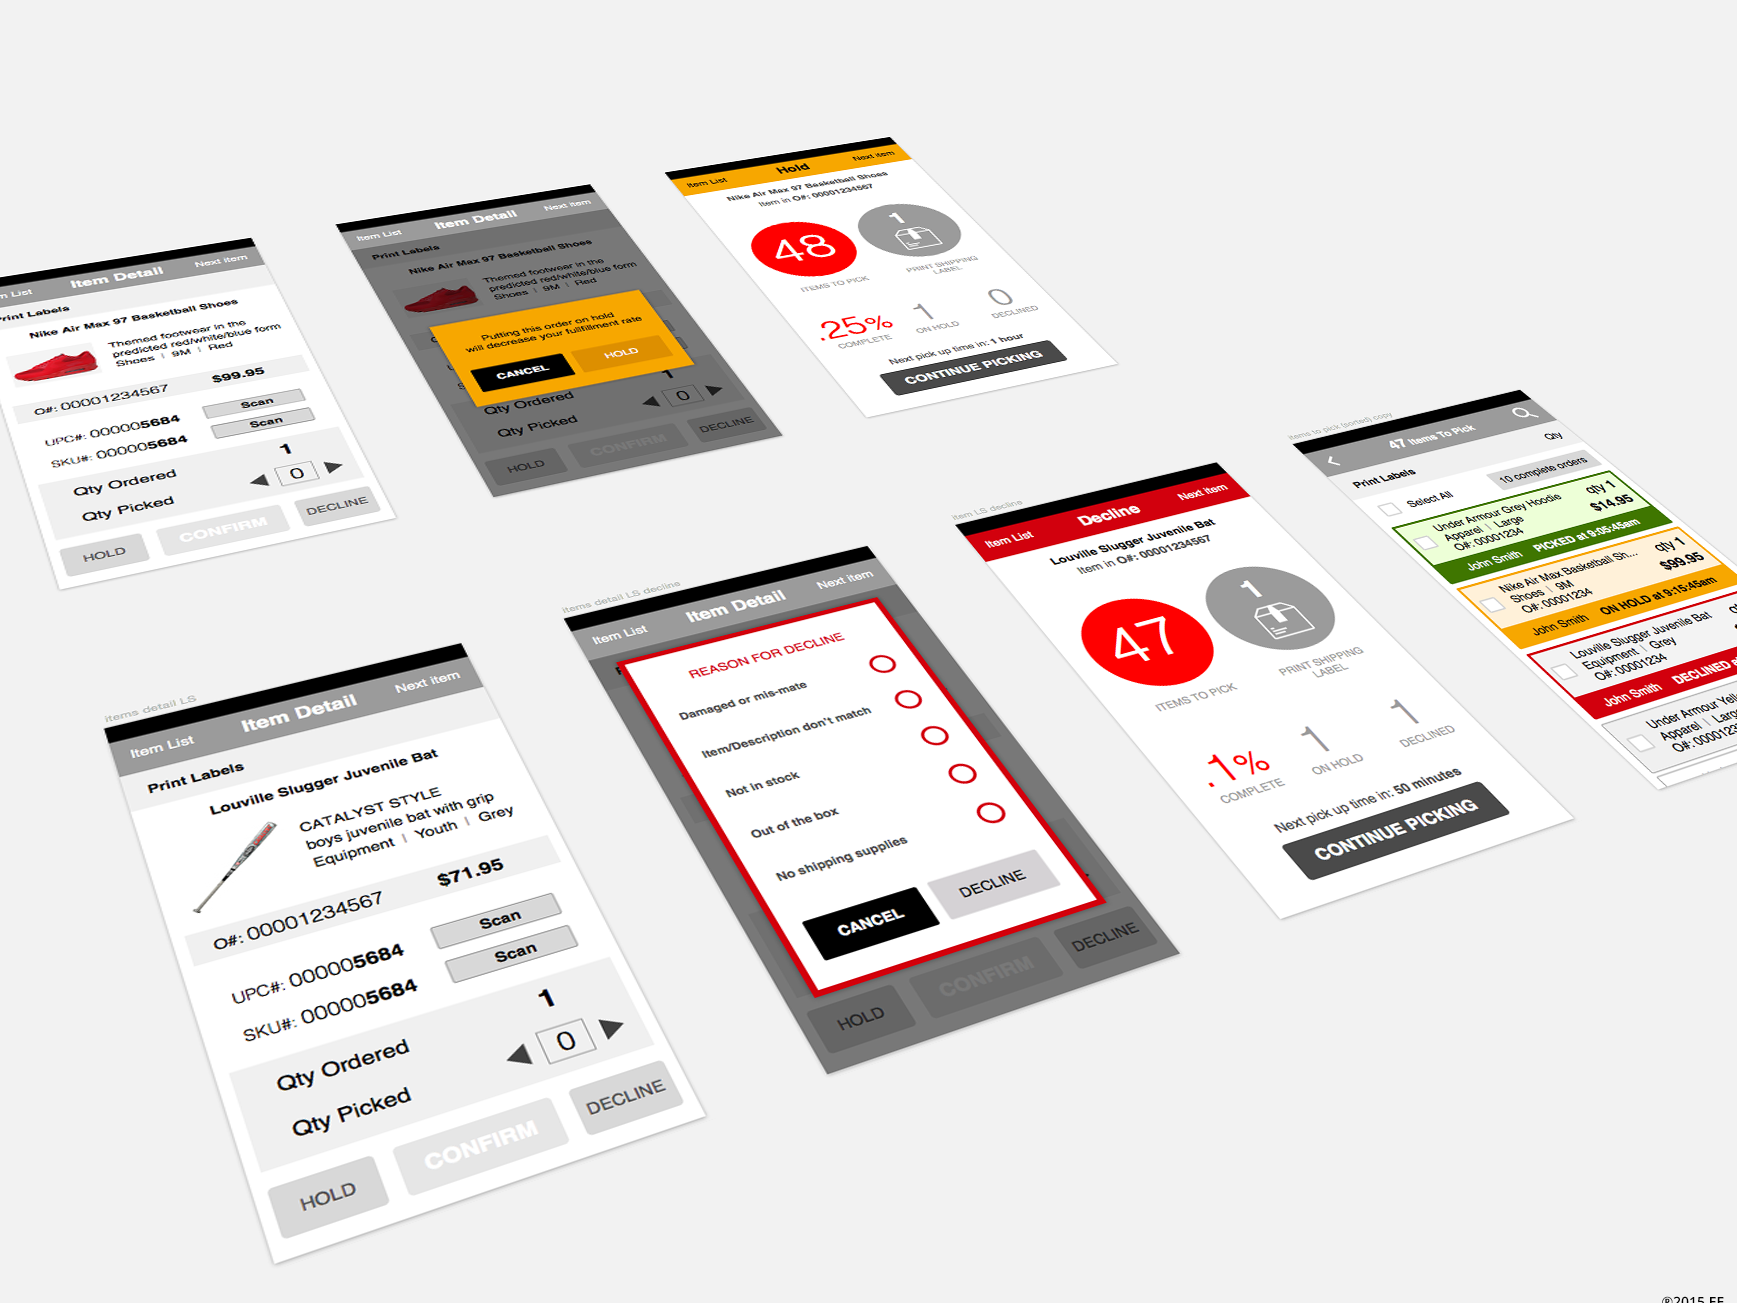
This screen cap shows the limited Excel spreadsheet experience that hindered dynamic decision-making on space allocation.


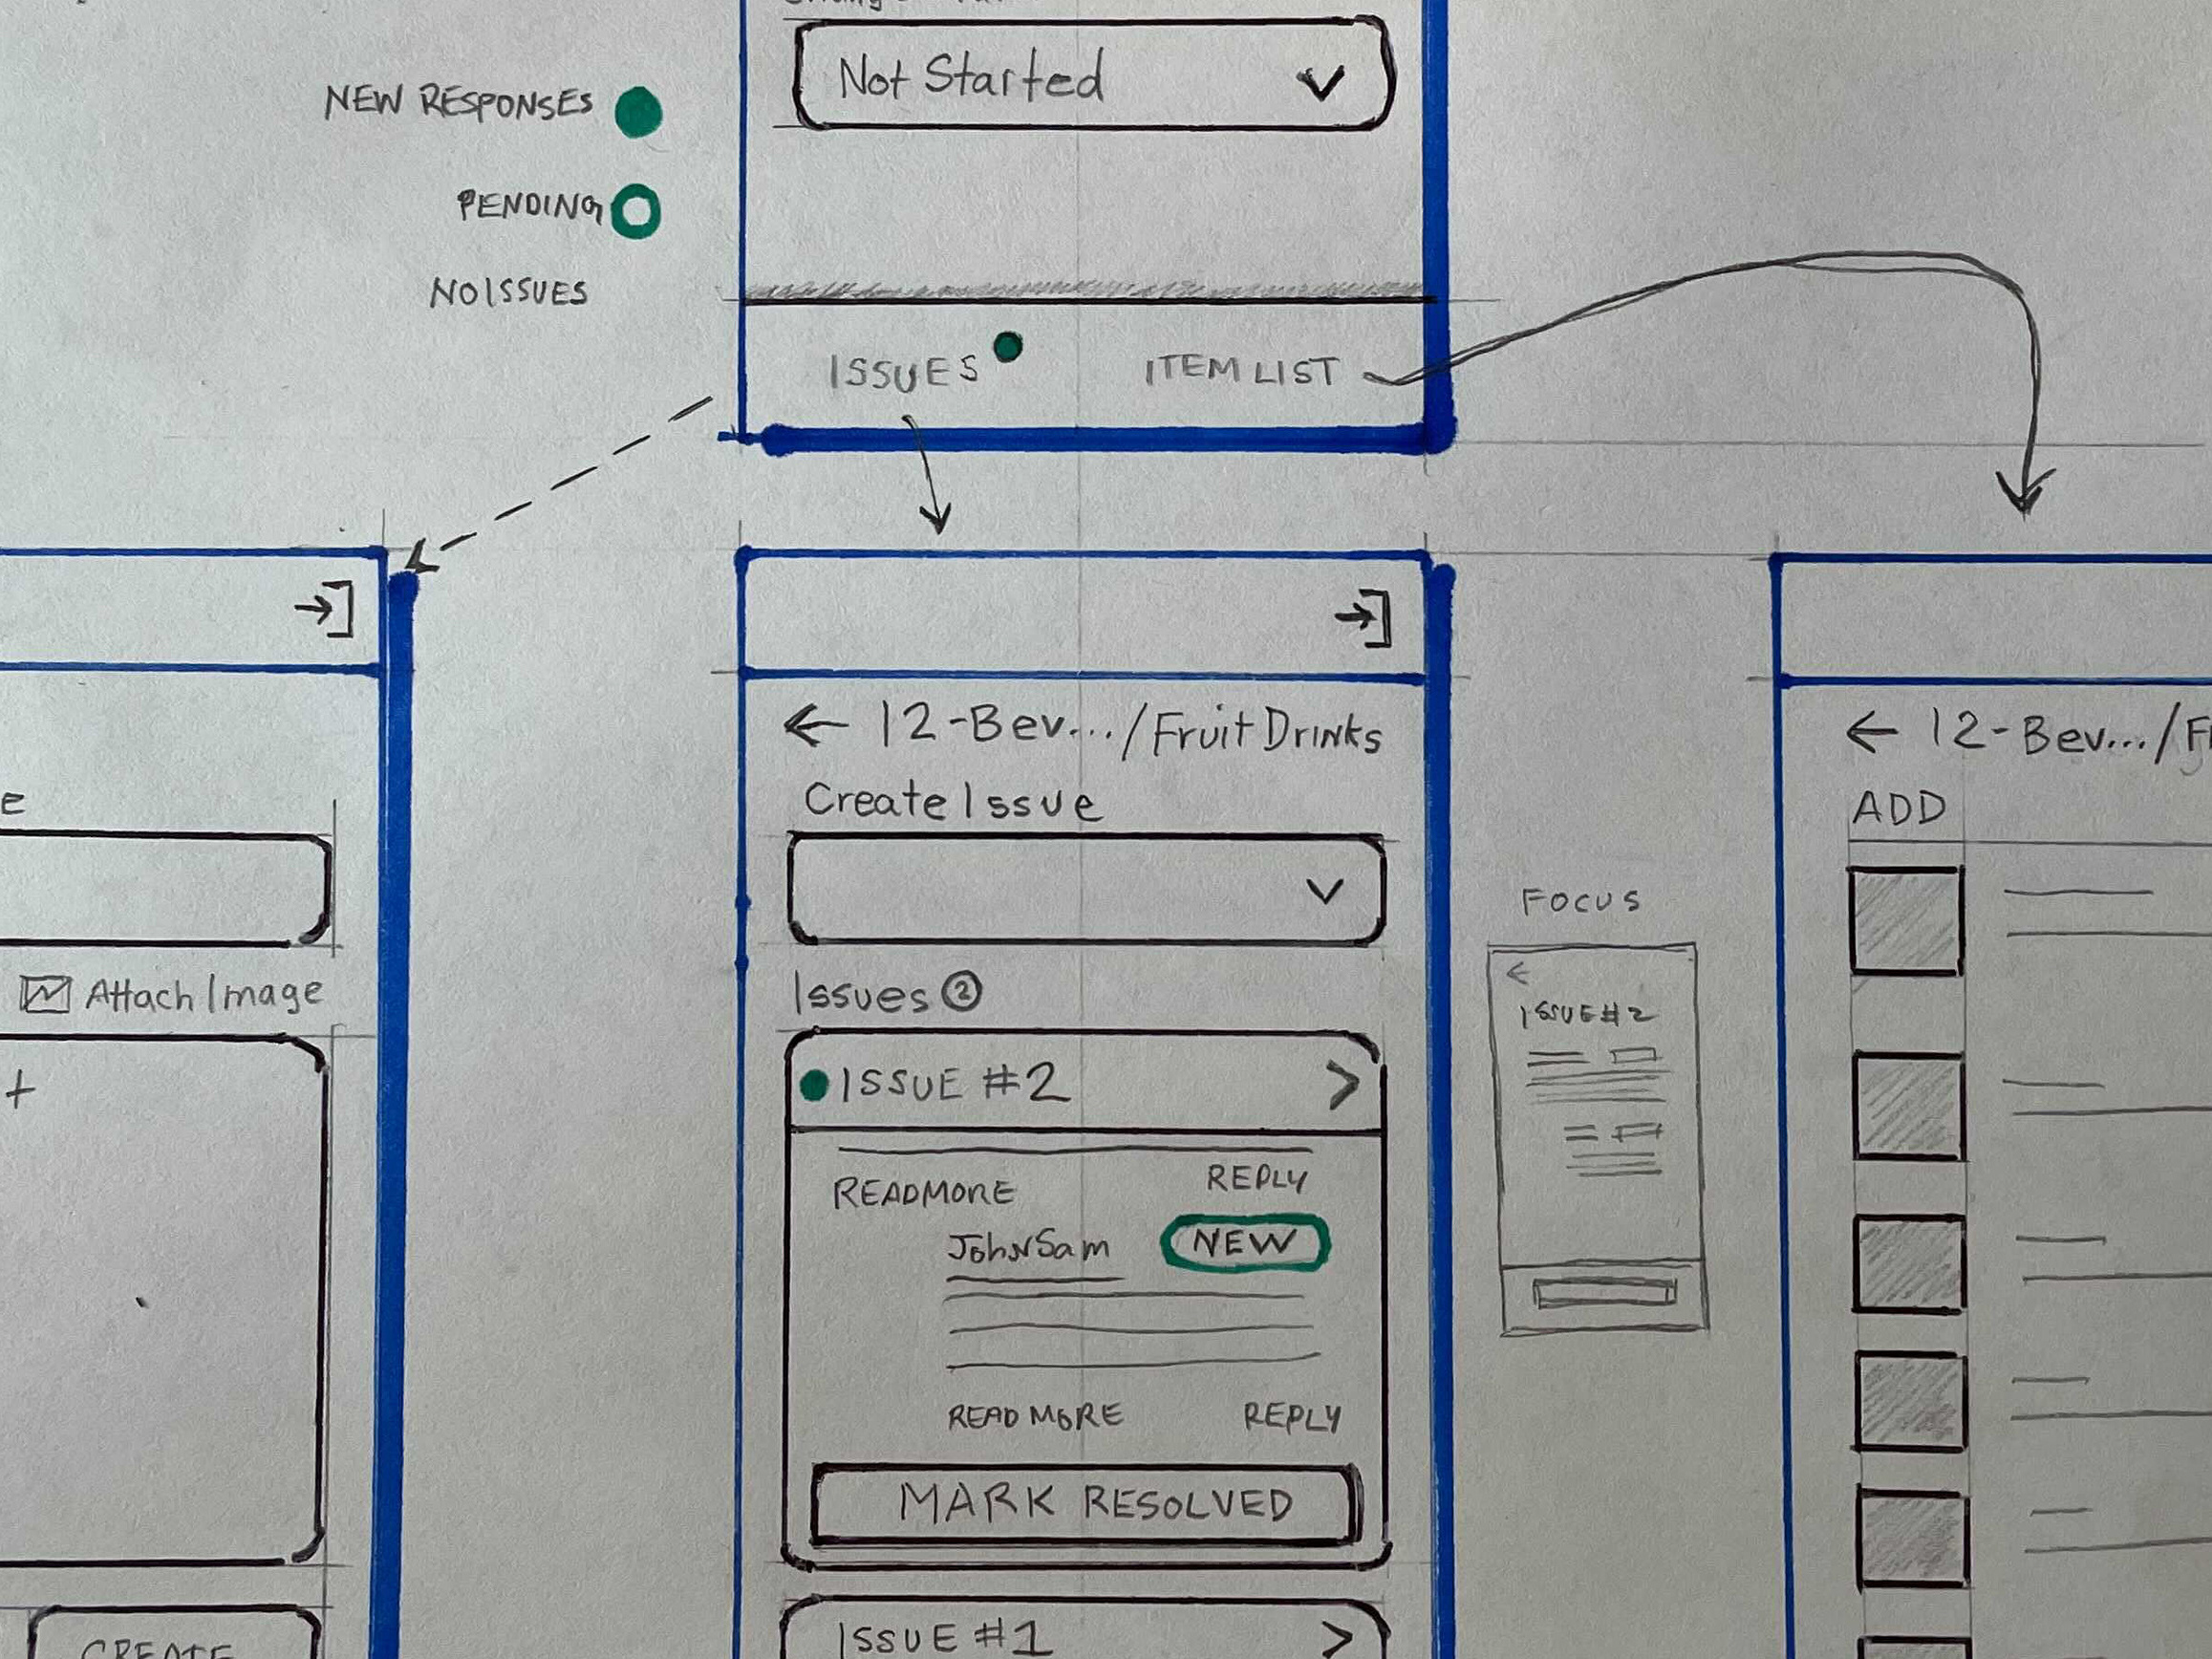
These early sketches show how I considered adding data points and summaries that allowed users to consider allocation by remodels or category, directly addressing the discovery insights we uncovered.

This user journey specifies all the necessary steps to complete a store optimization decision, including all team members that collaborate in the process, helping me address the issue of collaboration that was uncovered during discovery.

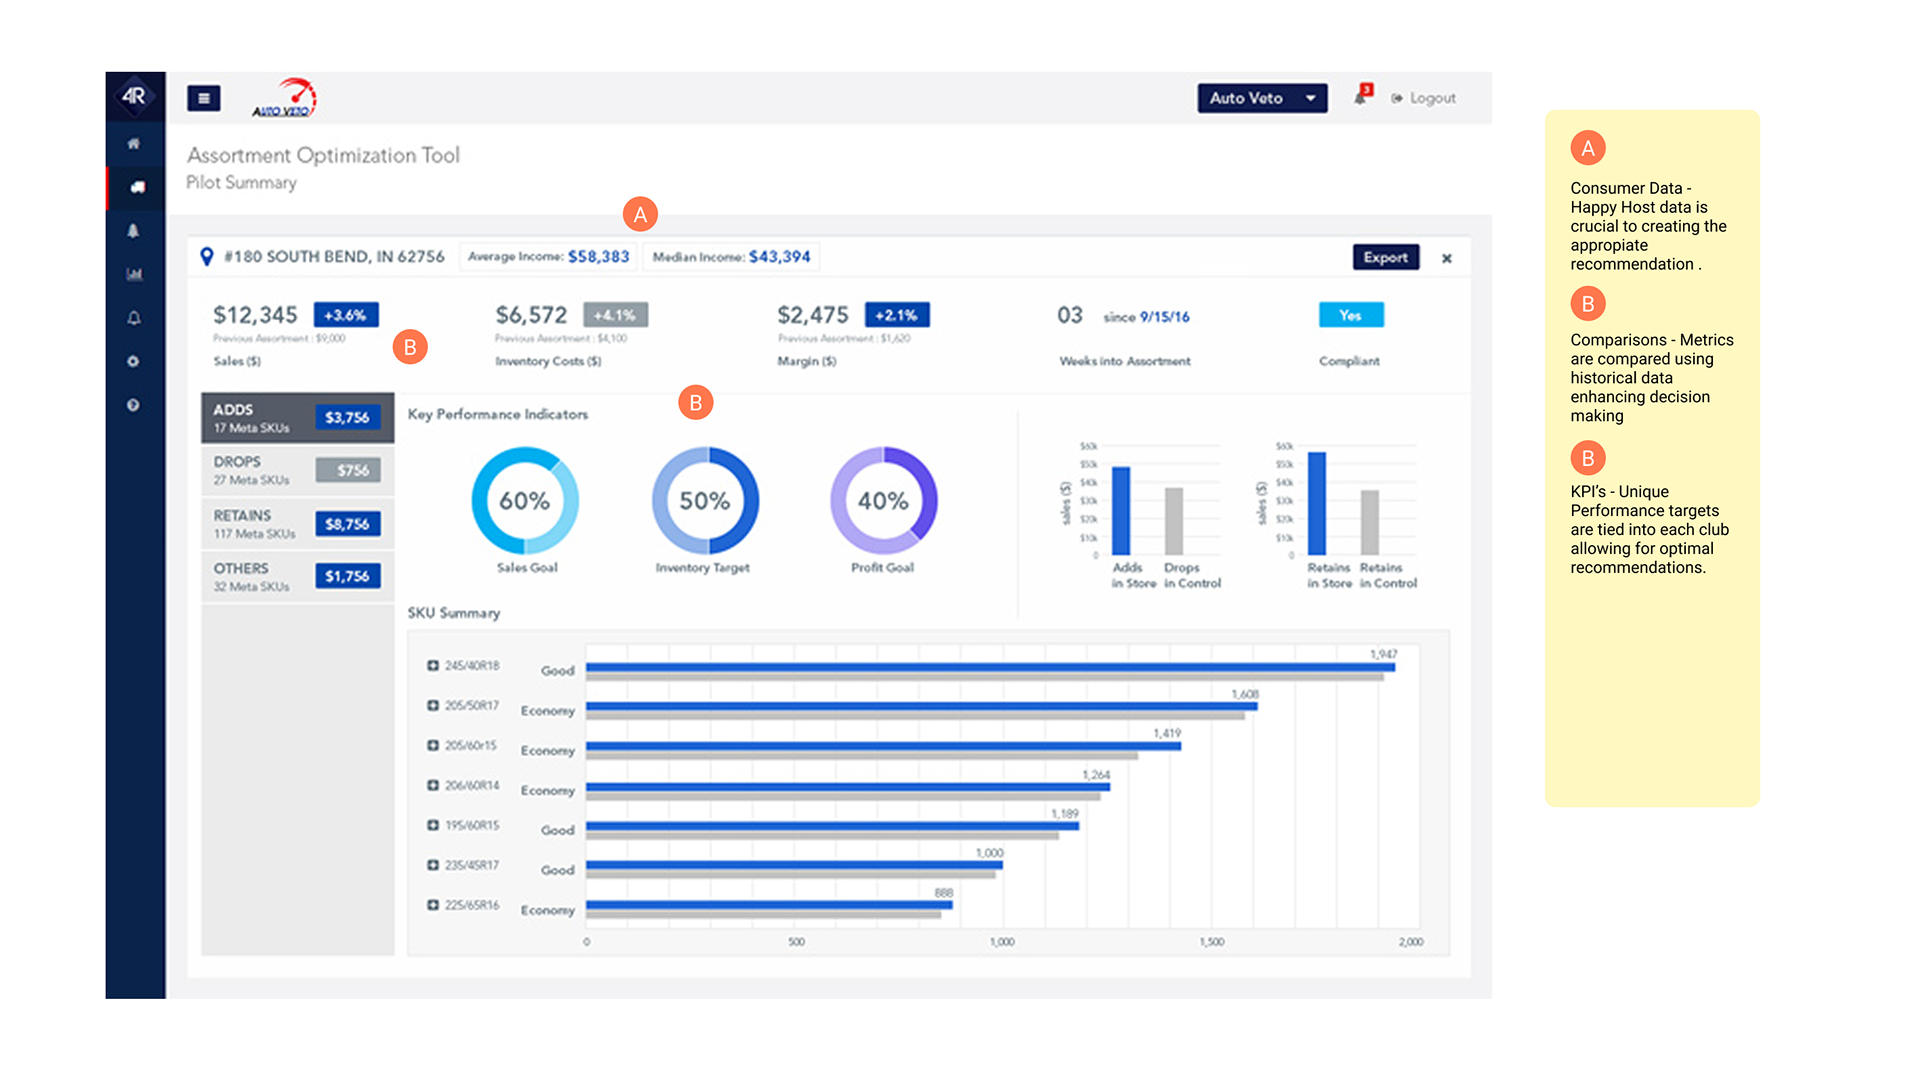
This wireframe show how customization of variables input by user, would all the the system to calculate most profitable optimization. The Objective dropdown would allow user to focus optimization on certain strategic or tactical goals.
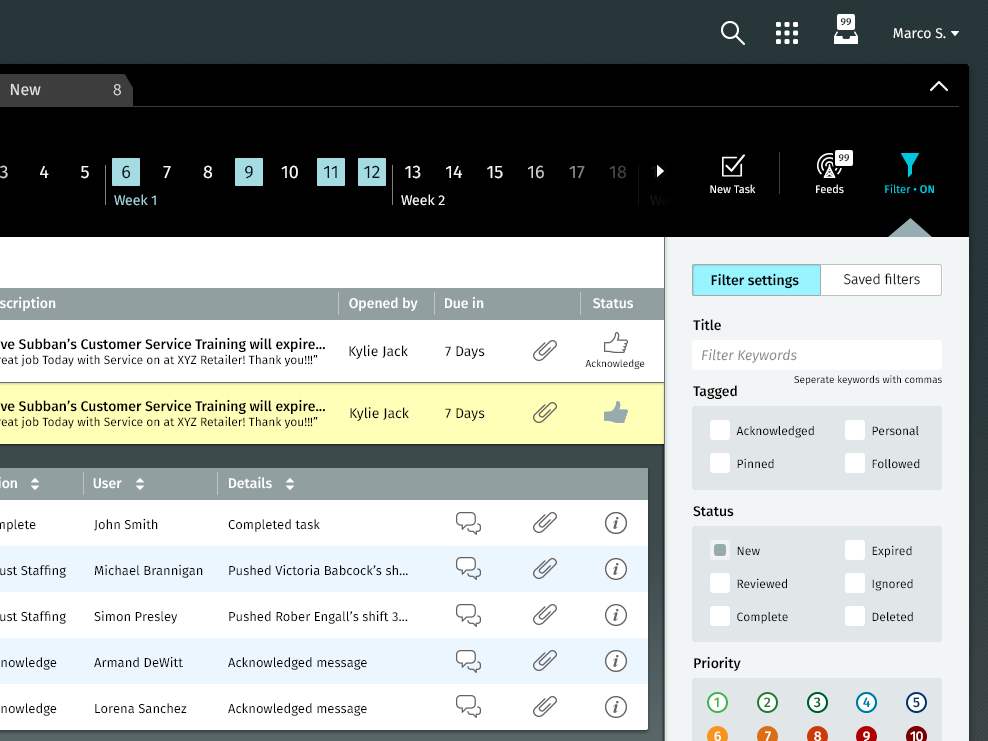
The results of optimization are presented to user together with their corresponding value proposition, aiding the user in making decisions on what category would benefit most from increased space allocation.
FINAL SOLUTION


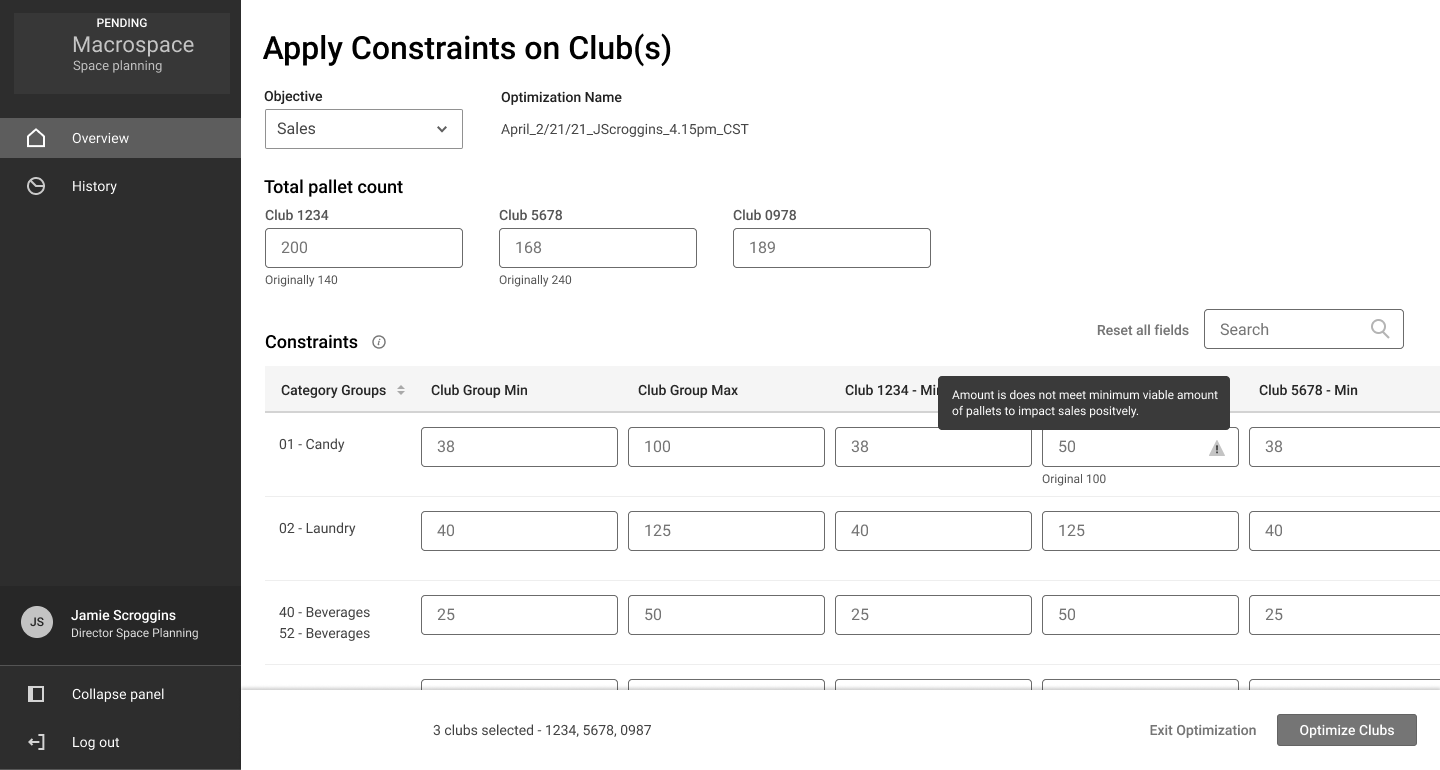
User can optimize multiple clubs using a predefined set of constraints to quickly get view results, allowing for a more unified approach to allocation.
As requests come in, user can easily add clubs to his list enabling users to get a view into multiple stores, resulting in comprehensive visibility across certain market sectors.

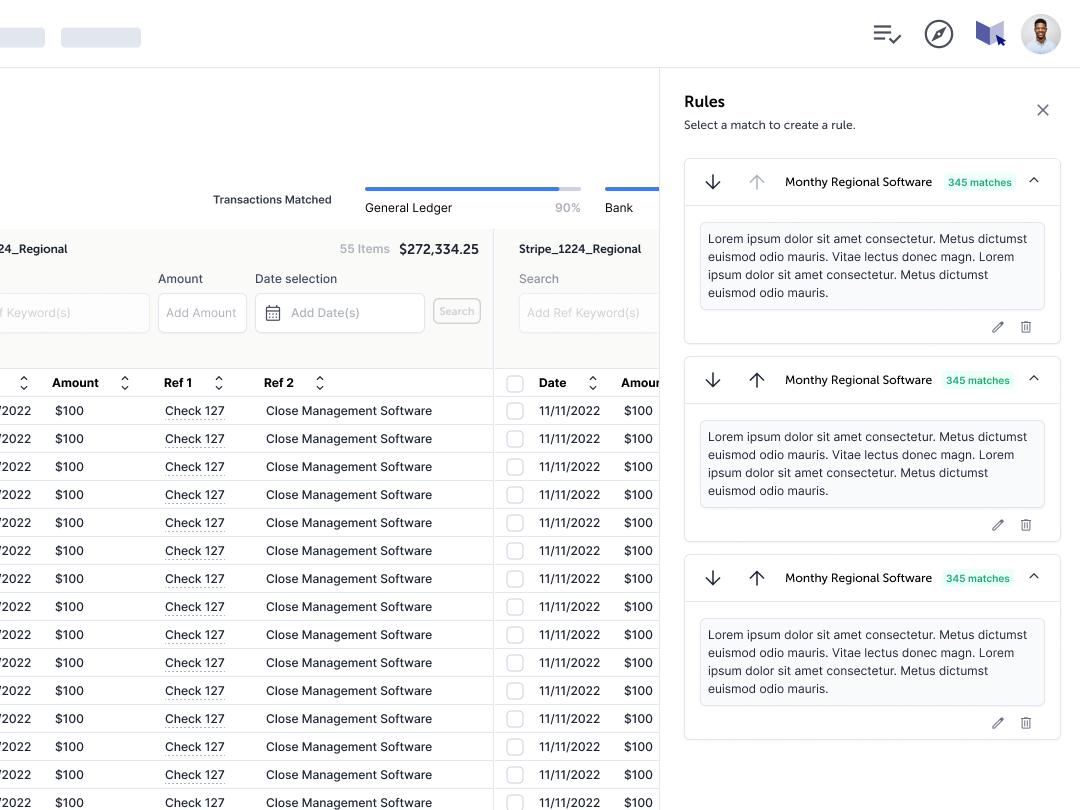
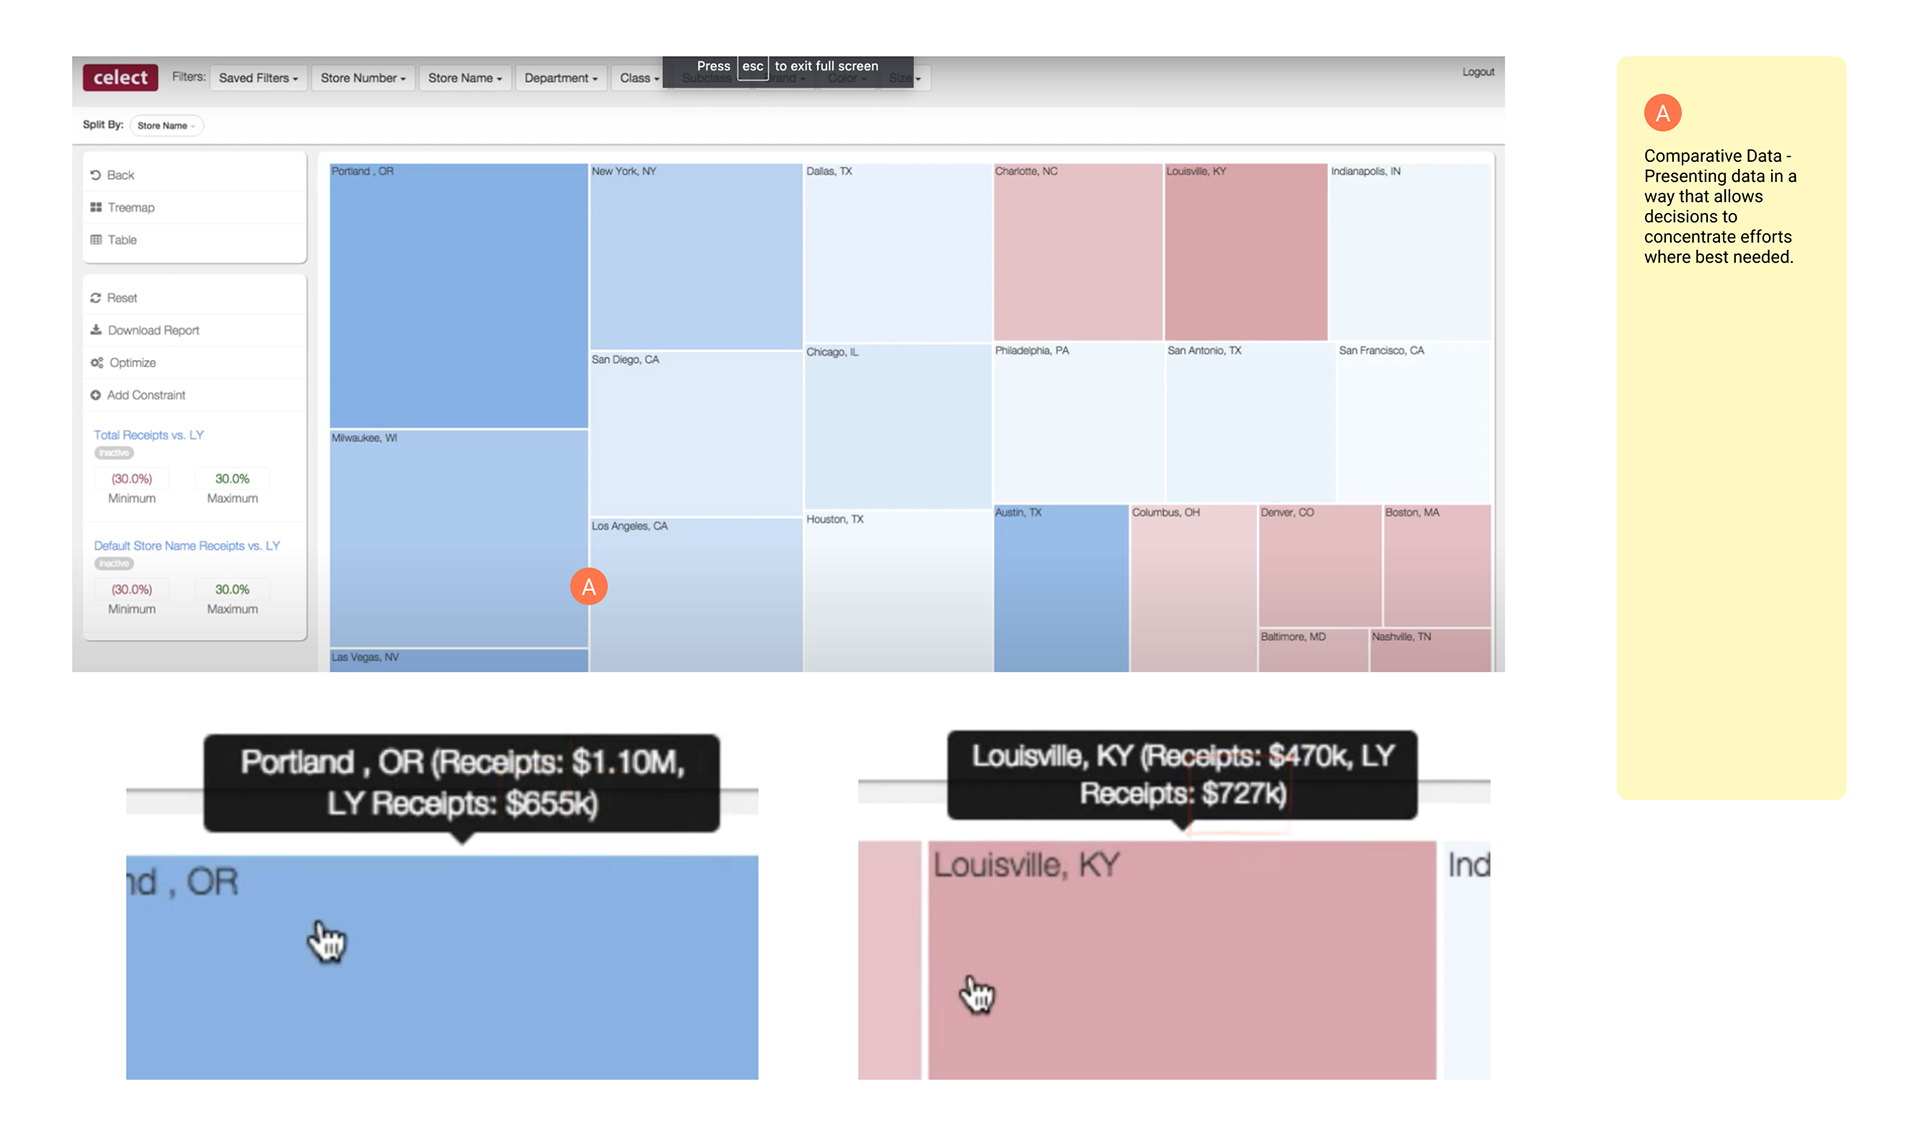
Viewing the details of optimization and filtering through them helps the user make final decisions.
Version and time stamp were called out the header level, together with a Annual Sales lift button displaying immediate guidance to make decisions.
ENGINEERING DELIVERY

My delivery to engineers included a prototype and Figma files that included details on ensuring all roles had visibility into the necessary data, by including a strong filtering system that allowed for focused views depending on user.
RESULTS
Incorporating Annual Sales Lift data enabled users to make 25% more accurate decisions, driving better product placement strategies and increasing confidence in outcomes.
Applying constraints data improved optimization precision by 30%, allowing users to tailor solutions to meet specific business needs effectively.
Contextual optimization details and advanced filtering tools empowered users to make 40% faster, data-driven decisions, reducing analysis time and improving productivity.
Leveraging existing design system components accelerated delivery to the engineering team by 20%, ensuring a seamless and efficient handoff process while maintaining design consistency.
WHAT I LEARNED
I was able to add many opportunities to our post-MVP backlog, ensuring the evolution of tool, reminding me that well executed discovery can continuously yield many ideas for future implementation
Moving away from an Excel spreadsheet to a completely new tool presents new users with a learning curve bu the scalability trades makes it worthwhile.